19 March 2019

Orbital periods

Oh my goodness, a lot has happened in the nearly two years since my last post. So much, in fact, that the thought of recapping it all is a total block on posting. So we're moving on.

I needed to check the orbital period of a companion to a 1.7 solar mass star, and the orbital separation is ~20 AU. I find myself having to do this sort of thing a lot, and I'm also supposed to be focusing on writing a paper, so instead I made a little figure that can serve as a handy reference if you need a ballpark feel for it. It shows the orbital period in years for a range of separations and primary masses. There is an implied assumption that the companion is much less massive than the primary.
The black dots are the Solar System planets (yes, including Pluto). The contour lines show constant orbital period. I like it but I think it would help a lot if I added the contour lines to the colorbar as well.

11 June 2017

Triathlon math part 2: What are realistic event speeds?

In my last post, I looked at triathlon events from purely a mathematical point of view, and asked the question: "Given how long each event is, which event helps your time the most if you decide to push the pace?" If you assume that you can swim as fast as you can bike, then our initial guess that the bike leg is the most important holds up, because the bike leg is so much longer.

That conclusion breaks down if you break that assumption! There are regions on the correlation matrices I plotted last time where the gain in time is very similar for different events. Which regions are physically realistic? Can I really improve my swimming speed from 1 km/hr to 30 km/hr? Is it worth it to sacrifice 3 km/hr on the bike in order to gain 2 km/hr on the run? The answer might really depend on which speed you're starting from and which speed you're going to for each event.

To get a more grounded idea of the relevant speeds, I downloaded the data from all 429 competitors in the Overall category for our race so we can see how actual athletes perform (data available here - my team was in the relay category so it doesn't include us).

When you look at how the overall triathlon finishing times are distributed, the first thing that pops out is that the top finishers are closer to the pack than the long tail of slower athletes:
 but if you look at everyone's average speed, it's much more evenly distributed:

These two plots are consistent with each other, since the separation between two competitors increases the longer they are out on the course. If one athlete has speed \( v \), and the other has a speed that is a fraction \( f \) of \( v \) (i.e. \( f \times v \), then the difference in time between them at the end of the course (distance \( d \)) is
\[
\Delta T = \frac{d}{v} \left(1 - \frac{1}{f}\right)
\]

- so it's not a linear relationship.

When you look at how the times for each event are distributed, there's a significant overlap between events in how long it takes - the fastest runners finish their 5k faster than a significant chunk of the swimmers (myself included)!

Considering the amount of overlap above, I was surprised by how neatly the events separate themselves out in terms of speed. Each event occupies a pretty well-defined space all by itself:
I think that comparing these two plots can clarify the answers we're seeking. The Speed histograms are all fairly symmetric and almost Normal - suggesting that the athletes are pulled randomly out of a population with some average value. On the other hand, the Time histograms all have right tails - especially the run and the bike. What this tells me is that if you're out in the tail of the run or bike time histograms, there is some other athlete very close to you in terms of fitness (read: there's hope!) who is running or biking just a little bit faster and getting a much bigger time benefit.

Next up (probably): focusing in on the space these speeds occupy on the correlation matrices from last time.

Edit: I updated the speed histograms with a fit to a Gaussian. The agreement looks pretty good!

05 June 2017

Triathlon math - Which event affects your time the most?

This weekend two friends and I had a blast doing the relay version of the Rock Hall Sprint Triathlon (we so cleverly named ourselves Team U+1F4A9 -- you can find our results here if you can figure out the name). I was really excited for my first open-water event since I started swimming consistently a few years ago, and my first ever swim race! I finished the 750 m-long swim leg in 17:45 -- a little slower than my pool times, but at least I finished, and I know that for next time I have to practice swimming in a straight line. Devin turned out a solid time for the bike course, and Carolyn finished the run 1:30 under her prediction, so all in all we had a really fun and successful triathlon.

Biting my medal to see if it's really made from real gold

During the long drive home, Devin and I got into a debate over whether the swim, the bike, or the run improve your time the most when you increase your pace. Our guess was that it's the bike, since it just takes up so much more time. Once I got home, I decided to model it and see if our guess holds up. Heads up - I use some basic calculus.

The total time it takes to complete a triathlon is just the sum of the times it takes to complete the three stages. Since the time it takes to cover a distance is distance / speed, this equation gave me my starting point.
\[ \mathrm{Total~time} = \frac{d_{\mathrm{swim}}}{v_{\mathrm{swim}}} + \frac{d_{\mathrm{bike}}}{v_{\mathrm{bike}}} + \frac{d_{\mathrm{run}}}{v_{\mathrm{run}}} \] For a given race, the different distances are fixed. For example, for our race, the swim was 750 m (0.75 km), the bike was 15 miles (24.14 km), and the run was 5k. The variables here are the three velocities - how fast you choose to take each leg. For our purposes, the average speed is perfectly fine (velocity and speed are interchangeable). The first question is: How does the total time change, if you take the different legs at different speeds? For these we want the partial derivatives: \[ \frac{\partial T}{\partial v_i} = - \frac{d_i}{v_i^2} \] (replace i with swim, bike, or run - it's the same for all of them. There are two takeaways here: First, the time you save depends on the distance you're covering. This makes intuitive sense, and is the reasoning behind our initial guess that the bike is the most important. However, there's a twist! The second takeaway is that the rate of change depends on the inverse of the velocity squared. This means that at slow speeds, a small change makes a big difference, but at high speeds, a small change makes very little difference. Going from 4 km/hr to 5 km/hr - reasonable swimming speeds - is a much bigger overall difference than going from 20 km/hr to 21 km/hr. In the plot here, look at how much steeper 1/x^2 is than 1/x at 5, and how much flatter it is around 20.
Here's what the derivatives look like for each event:


As we expected, the bike has the biggest derivate, meaning that it affects the time most. This is driven by the fact that d_bike is much larger than d_swim and d_run.
 
Here is the experiment I set up: Let's say you do the bike at velocity v1 one time, and velocity v2 the next. How much time did you gain? This is given by integrating \( \frac{\partial T}{\partial v_i} \) over the range of velocities, v1 to v2:
\[
dT = \int_{v_1}^{v_2} \frac{\partial T}{\partial v} dv
\]

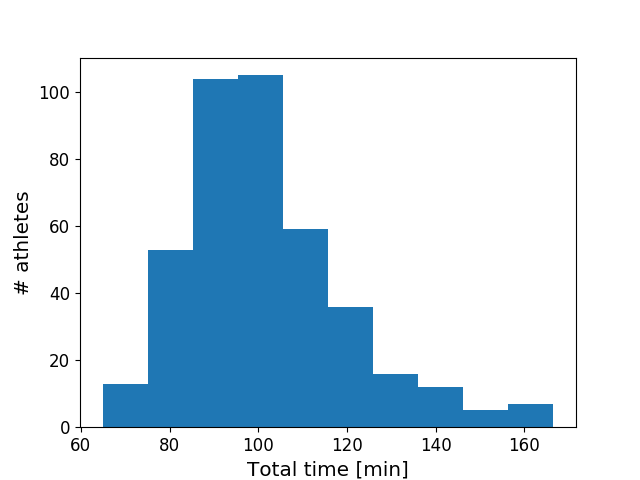
We're all set up now! I picked a velocity range that covers reasonable values for the run, bike, and swim - 1 km/hr to 40 km/hr - and calculated the total time you would gain if you did a leg at one velocity and then again at another velocity, for all pairs of velocities. This is what that looks like:


The darkness of each pixel tells you how many minutes you would save for the Rock Hall Sprint Triathlon if you did it at Speed 1 (x-axis) versus if you did it at Speed 2 (y axis). Darker = saving more time, as you can see in the scale bars. The white diagonal shows that, intuitively, if you do an event twice at the same speed, you will get 0 difference in time. The pixels below the white diagonal technically correspond to Speed 1 being faster than Speed 2, so the pixel values should be negative (i.e. you took longer the second time than the first time). I just multiplied them by -1 to make it easier to plot; in any case, the graphs are symmetric about the diagonal.

There are a few things that stand out. All the graphs are on the same scale, so the fact that the bike is the darkest of the three tells you that, all things being equal (like, Speed 1 and Speed 2), the bike nets you the best decrease in time. This is just because \(d_{\mathrm{bike}}\) is the longest.

We also said that improving at the slow end of the range nets you more improvement than on the fast end of the range, and we see that here with left and bottom sides being the darkest. That's important! Realistic swimming speeds are going to be concentrated down in the lower left, whereas cycling speeds will be further up the diagonal into the relatively brighter regions.

It's hard to tell by eye which event has the darkest regions over the relevant speeds. In the next post, I'll take a closer look on how our predictions hold up once you actually start to compare realistic speeds and speed changes for each event.

09 March 2017

Cassini flew by a weird moon and I made a gif of it

Cassini, NASA's doomed mission to Saturn, is doing its best to make us sad to see it go. It recently sent back data from a flyby of one of the smaller moons, Pan - and thanks to NASA's incredible open data philosophy, you don't have to be on the Cassini science team to have access to the raw images! We paid for this data, after all. Anyway, I made a gif! It was fun and easy! And now we know that Saturn has a moon that someone threw two balls of Play-Doh at each other, and they stuck.
I am super impressed by how easy the Cassini team made it to get the raw data. Check it out for yourself here: https://saturn.jpl.nasa.gov/galleries/raw-images/

Update:

People are furiously debating what Pan looks like most: dumplings, ravioli, a mini version of Saturn?

A little legwork and some Twitter hints reveals theories about how that bulge got there that are a little more reasonable than my smooshed Play Doh idea - they were probably accreted by Pan after Saturn's rings had settled down to their 20-m width but before Pan had sucked up everything nearby and cleared out the ring gap you can see in the gif. There's a nice discussion of how this might have worked here: https://ui.adsabs.harvard.edu/#abs/2007Sci...318.1622C/abstract

Here's the key figure:
  
The authors contend that particles still left in the gap get sucked up into Pan's L1 and L2 Lagrange points (ESA has some nice visuals here) depending on whether they are inside or outside of Pan's orbit, but Pan's gravity is so weak relative to Saturn that by the time this happens, they are basically in top of the moon already, and there isn't any room for them to land somewhere besides the equator (especially once the ridge started being more built up). 

The authors chime on on protoplanetary disks and gap clearing (h/t ALMA):

This parting shot from the conclusion is a little more far-fetched, IMO, especially since the authors make it clear that the accretion mechanism in this case is highly dependent on the particular porous nature of the particles in Saturn's rings, which may not be true for disks in general:
But hey, that's what a parting shot is for.


As a post-script, there's another moon (Atlas) on approximately the same orbit near the A ring that also has a ridged structure, but no such dramatic flyby. It's weird and flat, and I gif'd it anyway:

Double update: this is my favorite write-up so far; amazing movies https://lightsinthedark.com/2017/03/09/our-best-ever-look-at-pan-saturns-little-ufo/

03 March 2017

Habitable niches are better than habitable zones (and, it's nice to write something again!)

I just came out of a great, if brief, conversation with Dr. Catharine Conley, NASA's Planetary Protection Officer. Part of her job involves ensuring that we don't contaminate the rest of the Solar System with Earth organisms. As a result, she spends a lot of her time thinking about how resistant various Earth critters might be to dying, and how well-suited they are to surviving in the various environments they might encounter around the Solar System as they hitch a ride on our robots.

Since I spend my time thinking about planets in other solar systems, I asked her if her job had led her to have opinions on the search for life on exoplanets. Her response was really a new perspective for me - the idea of habitable niches rather than habitable zones. The point was that many solar system bodies have regions that are quite Earth-like, at least in terms of resembling regions of Earth where life has been found, even if they don't resemble Earth as a whole. (A metabolically unique Earth organism she mentioned in her talk was Desulforudis audaxviator, a species of bacterium that subsists off of the byproducts of radioactive decay from the minerals that make up the rocks where it lives - it would be quite happy to set up shop underground somewhere on Mars.) Furthermore, it is critical to think about how an environment would affect microbial life - which were, after all, the earliest forms of life on Earth. Effects on small scales run counter to much of our intuition. Bacteria don't care much about gravity, for example, and could be just as happy burrowed in Pluto or an asteroid as in your gut.

She went so far as to suggest that perhaps even the Kuiper belt might be the the most hospitable region of the solar system, since it was nice and cozy for the first few million years. This is amazing! Dr. Conley is shattering the habitable zone and scattering its pieces across the Solar System.

I'm sure I'll be thinking for a long time about the implications of this habitable niche paradigm on the search for life. On one hand, it is a refreshing rebuttal to exoplanetology's relentless obsession with the habitable zone, which is poorly defined and formulaicly applied to every known exoplanet system we have thus far discovered. It's the equivalent of the ice, desert, and swamp worlds of Star Wars, when these are all just samples of the variety of ecosystems on Earth. On the other hand, it doesn't completely depart from the idea that the habitable niche itself must approximate Earth-like conditions. I should concede that the working definition of the habitable zone is really nobody's fault and is probably the best we can do given the limitations of our data, which can often only guess at the bulk properties of discovered planets. It doesn't stop me from hating it, though. I look forward to a future when we can take a more fine-grained approach to planetary geography.

Going forward, exploring the Solar System will give us a much better picture of the variety of potentially habitable environments that may exist in all planetary systems. Considering how every single exoplanetary system we have discovered so far is categorically different from the Solar System, the number of possibilities multiplies.

She really painted an extremely optimistic picture for life in the Solar System and in the Milky Way. It left me excited, but also puzzled: if there are so many more opportunities for life than we ever conceived, then where is everybody?

To sum it up:

1. Forget the "habitable zone": many SS bodies have niches that are habitable, especially under the surface.
2. Life starts on small scales, and you really have to think what a particular environment would be like for a microbe.

Helpful links:

There are a couple resources that both friendly to a broad audience, and curate (and visualize! accessibly!) data on potentially habitable exoplanets:

The Planetary Habitability Laboratory from the University of Puerto Rico has a nice tool and explanation of the habitable zone:
The Habitable Zone Gallery also has a very brief explanation, and really cool movies of the orbits of known exoplanets that pass through habitable zones:

12 February 2016

Gravitational waves!

I never post on here except when my non-physicist friends ask me to explain something, and then I actually get the motivation to write it up. It's really funny that my last post, from over a year ago, was on the same topic. Now LIGO just released their results on a direct observation of gravitational waves!

On Fri, Feb 12, 2016 at 10:33 AM Gaetano Mina wrote:
Aggle please ELI5 the gravity physics discovery which is allegedly the biggest science deal of the decade.

Thanks. 
(For the record, ELI5 means "Explain like I'm 5")

My response:

It's only super awesome! They measured the signal from two black holes that were orbiting around each other until they merged. The NYT has a pretty good video that explains what's going on (the NYT data visualization people do amazing work in general) http://www.nytimes.com/2016/02/12/science/ligo-gravitational-waves-black-holes-einstein.html - I really love the way they explain how the interferometer works at 2:30


"Gravity waves" were something that was predicted a hundred years ago, and we've been looking for them ever since! The story of their prediction is kind of funny. Einstein came up with general relativity, but it was someone else who used it to predict that general relativity allowed "gravity waves" to exist. Einstein made some calculations and was all like "no you're wrong, waves are not possible" but he had made a mistake - and when he tried to publish this, the journal was like "bro u messed up" and he was like "no u" and got super pissed off and boycotted them for the rest of his life.

OK, so back to what's going on - If you swish your hand around in a circle in a pool of water, you'll make a spiral wave going out. This is basically what happens with the black holes that are orbiting each other, with the "water" in this case being spacetime itself. The wave itself is kind of weird - it's a compressed region of spacetime itself that's moving out from the orbiting black holes. You can sort of see what this looks like if you take a slinky and push it back and forth. This was the best video I found of that: https://www.youtube.com/watch?v=ubRlaCCQfDk
This is where the actual measurement gets even weirder - since it's spacetime itself that is changing shape, you can't measure changes with anything made of matter, because that changes size too. The only thing you can use is light, since the speed of light is always constant. This means they had to use a really, really long laser beam and measure the time it takes for the laser to return after bouncing off of a mirror. Since the speed of light is always the same, it isn't affected by the ripple in spacetime that's passing through the detector.
Next, these lasers are built here on Earth, and they're super sensitive, so they pick up movement like earthquakes, trees falling, and lots of other stuff that you don't care about, so somehow the LIGO people had to find a way to separate the gravitational wave signal from all this noise. They picked something that's really unique - the exact moment when the black holes spiral in faster and faster and faster and then merge. That's what they show in these plots here:
https://www.ligo.caltech.edu/image/ligo20160211a

It turns out that the frequencies are actually in the normal range of human hearing, so we can make a sound out of them! https://soundcloud.com/emily-lakdawalla/ligochirp  - this is the sound of two black holes merging. People are getting pretty excited about trying to chirp like LIGO.


So from 1.3 billion light years away, we caught the final moments of a black hole merger and confirmed a hundred-year-old consequence of general relativity that had never been seen before.

05 February 2015

No more gravitational waves :(

Back in March, BICEP2 made big news when they announced by press release that they had found gravitational waves left over from the Big Bang. This really made the rounds and gained a lot of interest from the popular press as well as the scientific press. At the time I was afraid that an internal review of the data wasn't enough, and that after all this noise they would just be wrong... and it turns out I was. This week they confirmed with PLANCK data that the signal comes from interstellar dust, and I was sad. The idea that the signal could be dust was first put forward really quickly after the initial press release, and as time went on it looked more and more likely to be true.

Today Nature published an editorial that strongly defended their enthusiastic reporting of the original BICEP2 results. They said, quite justifiably:
Nature has a stake in discussions of the gravitational-waves story. Our news team was among those tipped off about the claim in advance. We were proud of our (extensive) coverage, both in print and online, at the time. We remain so now. Like most other news organizations, we reported the claims from the provisional paper accurately and, like almost all the coverage, were sure to include the caveat that the findings would need to be confirmed. That is not to claim that the press can be given a free pass on this. Its job is to ask questions after all. But it is not always possible for journalists — even the best science writers — to provide the answers.

Then they aimed their sights at me, because I had been saying, mostly to friends, that BICEP2 should have waited at least for peer-review before making a big public announcement.
What about the promised lessons for scientists? As we have pointed out before, researchers must not be afraid to be wrong.
Their point was that even a peer-reviewed publication - something I had said should have been required before making a public announcement - isn't really ever the final word on science. More fundamentally, scientists must live with some level of uncertainty that what we think we know might turn out to be wrong, and we can't let that stop us from pushing forward.

I needed this reminder to think deeper than doing some easy armchair quarterbacking, and that I shouldn't be such a grump over people getting excited about new discoveries.

Fortunately the BICEP2 results are really just a sentence out of an ongoing conversation about finding these Big Bang remnants. Hopefully my buddies at CLASS can nail the discovery! And this poor guy can get his champagne back.